
PWM Perspectives provides valuable insights into market dynamics, investment opportunities through Q Wealth, and key financial indicators. We are committed to keeping you informed with timely updates from PWM Private Wealth Counsel and our partner, Q Wealth Partners, a registered Portfolio Manager providing Portfolio Management Services.
In many ways, this fall has felt like one long election night. We had the on-again, off-again trade talks with Washington, the PQ win in Quebec, the snap BC election, Albertans’ vote on separation, and the U.S. midterms (which ate up a fair share of the headlines both before and after November 3).
If you want an in-depth review of these elections and votes, their outcomes and what they mean, there’s many a political commentator and website that will give you far more detail than we would profess to have.
But what we do know is that political events, and the outcomes of votes and elections, can feel like they have a major impact on your investment portfolio, and on your financial plan for the next year, or five, or ten. The truth is, much of what you read is just “noise.” And noise can do funny things to your brain.
Take the U.S. midterms. A couple of weeks before the vote, three professional forecasters, looking at largely the same polls, gave Democrats anywhere from a 56% to a 75% chance of winning the Senate, and from 77% to 94% for the House. The chart below compares them with the final result. [RESULTS: [PARTY] won the House and [PARTY] won the Senate.]
Same Polls, Three Different Answers
Odds of Democrats winning control of each chamber, 2026 U.S. midterms. Forecasts as of October 18 to 20, 2026, compared with the final result.
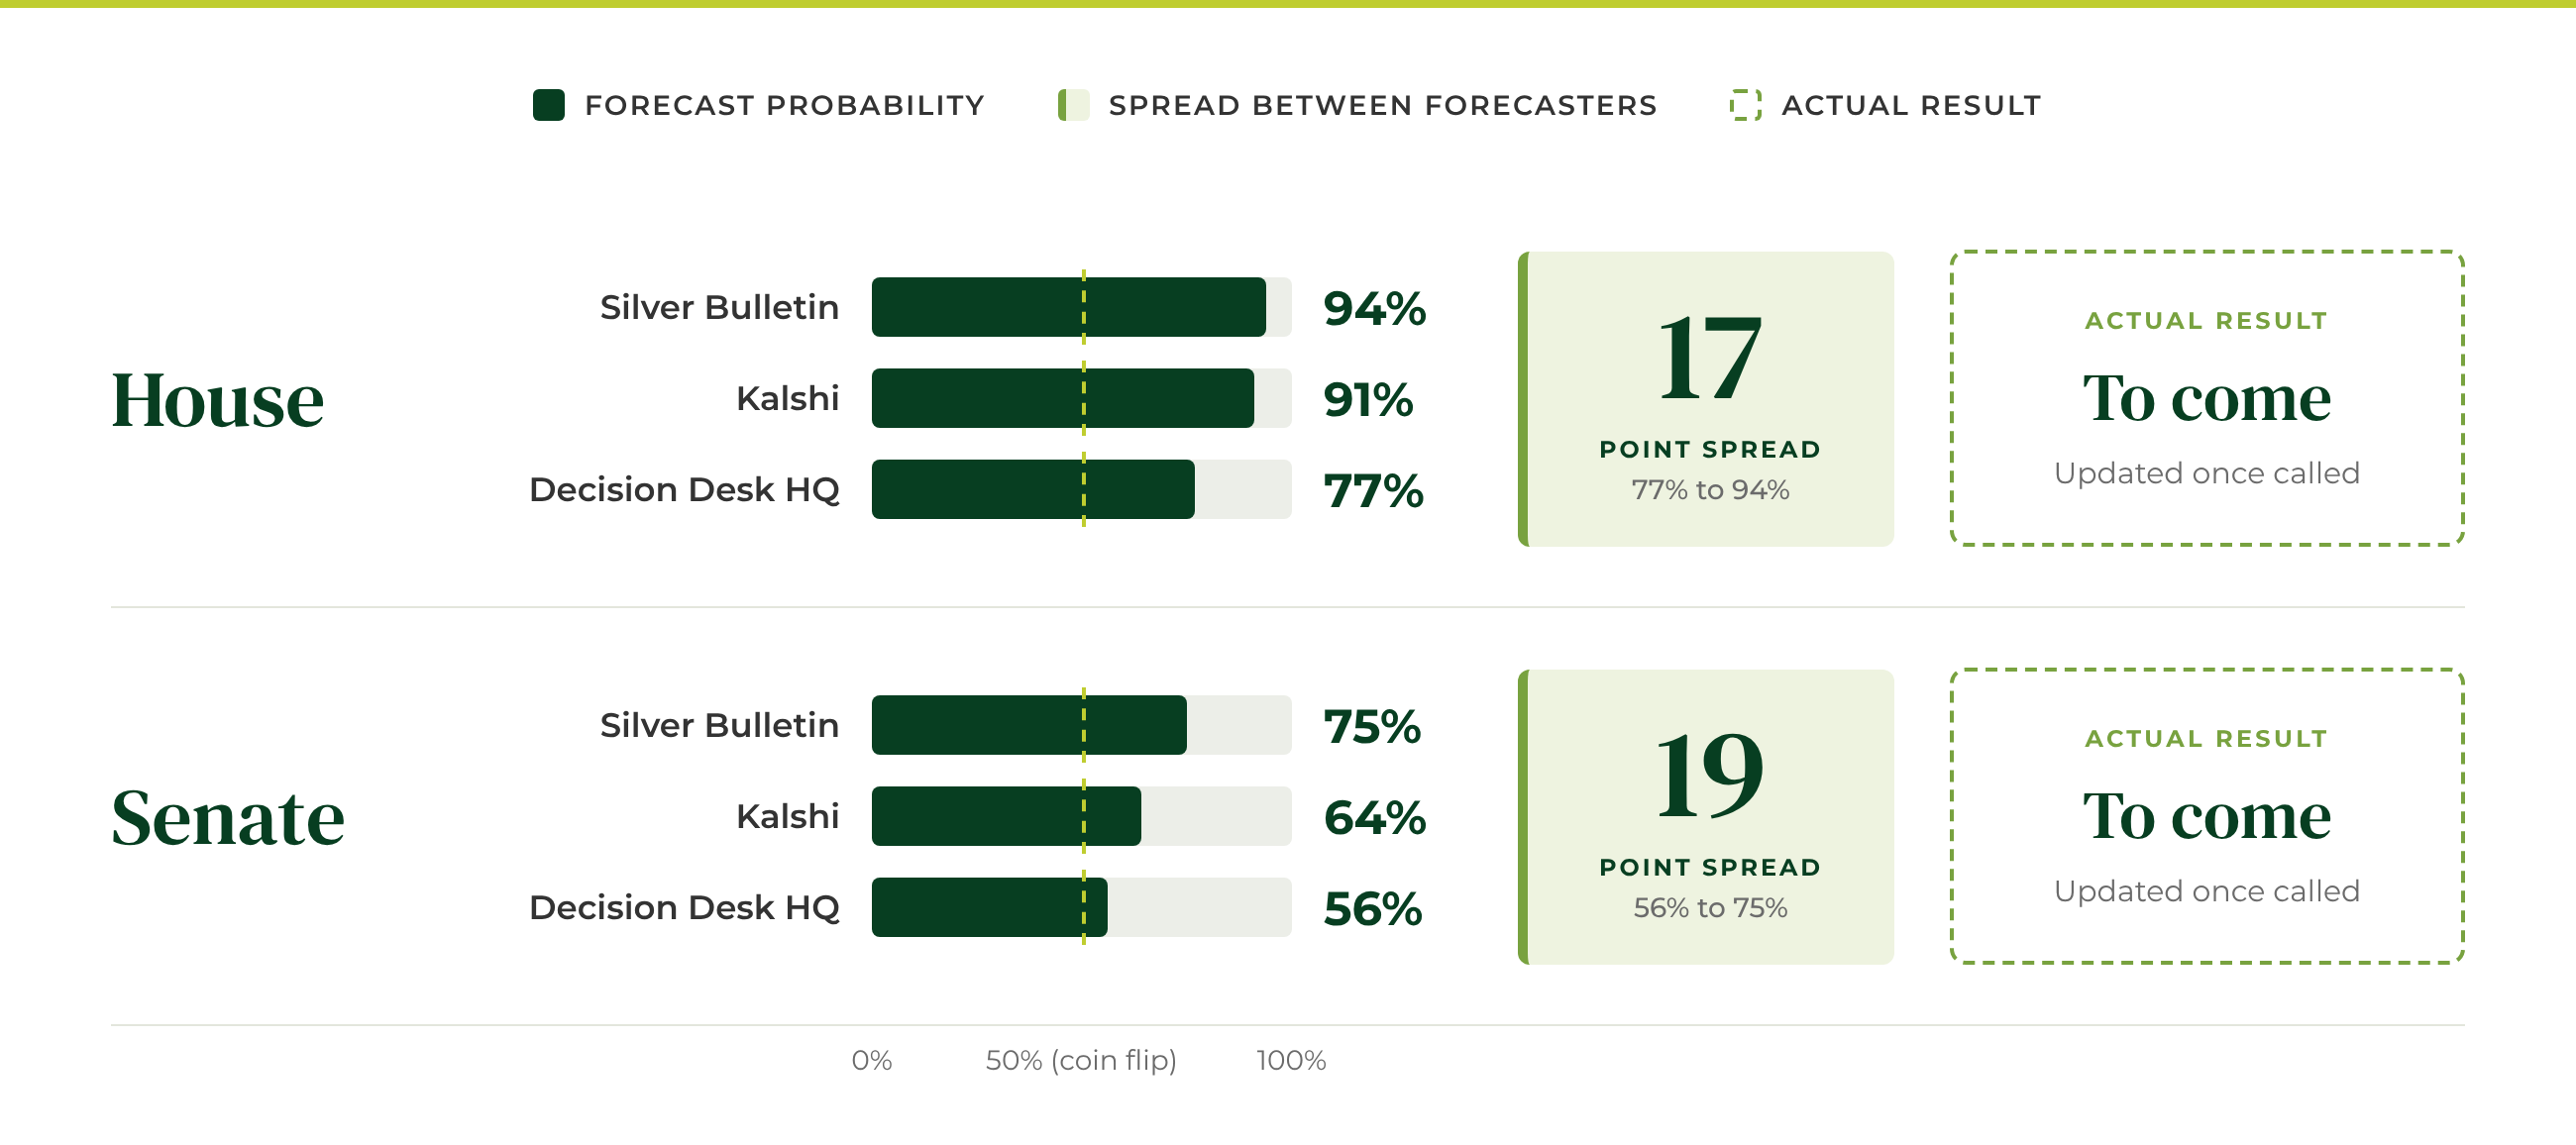
Source: Silver Bulletin model via The Conversation (Oct. 18, 2026), Kalshi (Oct. 20, 2026), Decision Desk HQ (Oct. 19, 2026). This graphic is for informational and illustrative purposes only. The data provided is believed to be accurate, but there is no guarantee of its accuracy, completeness, or timeliness. This is not a recommendation or offer of any financial product. Forecasts are probabilities of a party winning control of each chamber, not predictions of vote share or seat counts. The chart illustrates that professional forecasters looking at largely the same polling arrived at noticeably different probabilities, an example of what Daniel Kahneman called noise.
The late Daniel Kahneman, who won the Nobel Prize in Economics, co-wrote a book about this, called Noise: A Flaw in Human Judgment. We all think about biases (or at least understand them better) more than we think about noise. A bias is when judgments consistently skew in one direction. Noise, however, is the unwanted variability in judgments that should be the same, where one person’s decision lands somewhere quite different from another’s. Give the same facts to different people, or to the same person on a different day, and you can get different decisions, even when those facts have been carefully analyzed.
As a concrete example, in one study, insurance executives expected their underwriters’ quotes on the same case to differ by about 10%, but the actual median difference was 55%. As the authors put it, “Wherever there is judgment, there is noise, and more of it than you think.”
By the way, for investors, the type that matters most is what they call occasion noise, where the same person with the same facts makes a different call depending on their mood or the morning’s news, even if that news doesn’t actually change anything about the decision in front of them.
This ties back to April’s PWM Perspectives on Daniel Wegner’s “white bear” study, and politics makes it even harder to disconnect from the headlines because it can feel personal, and it can shift our emotions and psychology. Shawn Achor, in a piece for Wharton, cites an estimate that the brain receives about 11 million bits of information per second but can only process about 40. Because of this overload, it has to pick and choose, and it’s wired to notice threats first.
Even the professionals struggle with this. Joachim Klement recently highlighted a study of U.S. hedge funds where the portfolios most aligned with the sitting President’s economic policies underperformed the least aligned by about 4.4% per year (most likely because those intentions were already priced in). As Klement puts it, “The market doesn’t care about your politics.”
The data shows that political predictions also make for poor investment advice. Kiplinger pointed out that heading into President Trump’s first term, investors were told to buy Big Oil and small caps and avoid Big Tech and renewables, and all four calls were wrong. It’s a story that replays with each administration. Under Obama, it was green energy, yet from March 2009 to early 2016 the Guggenheim Solar ETF lost about half its value while the S&P 500 gained almost 230%. And according to LPL Financial, the S&P 500 has risen in the 12 months after a midterm election 18 straight times going back to 1954.
To illustrate this, the chart below shows the S&P 500 since 1950, shaded by which party held the White House. While past performance doesn’t indicate future results, the index has climbed under both parties, from under 20 in 1950 to 7,691 as of October 19.
Ignoring Politics When Investing
S&P 500 price under Democrats and Republicans since 1950.
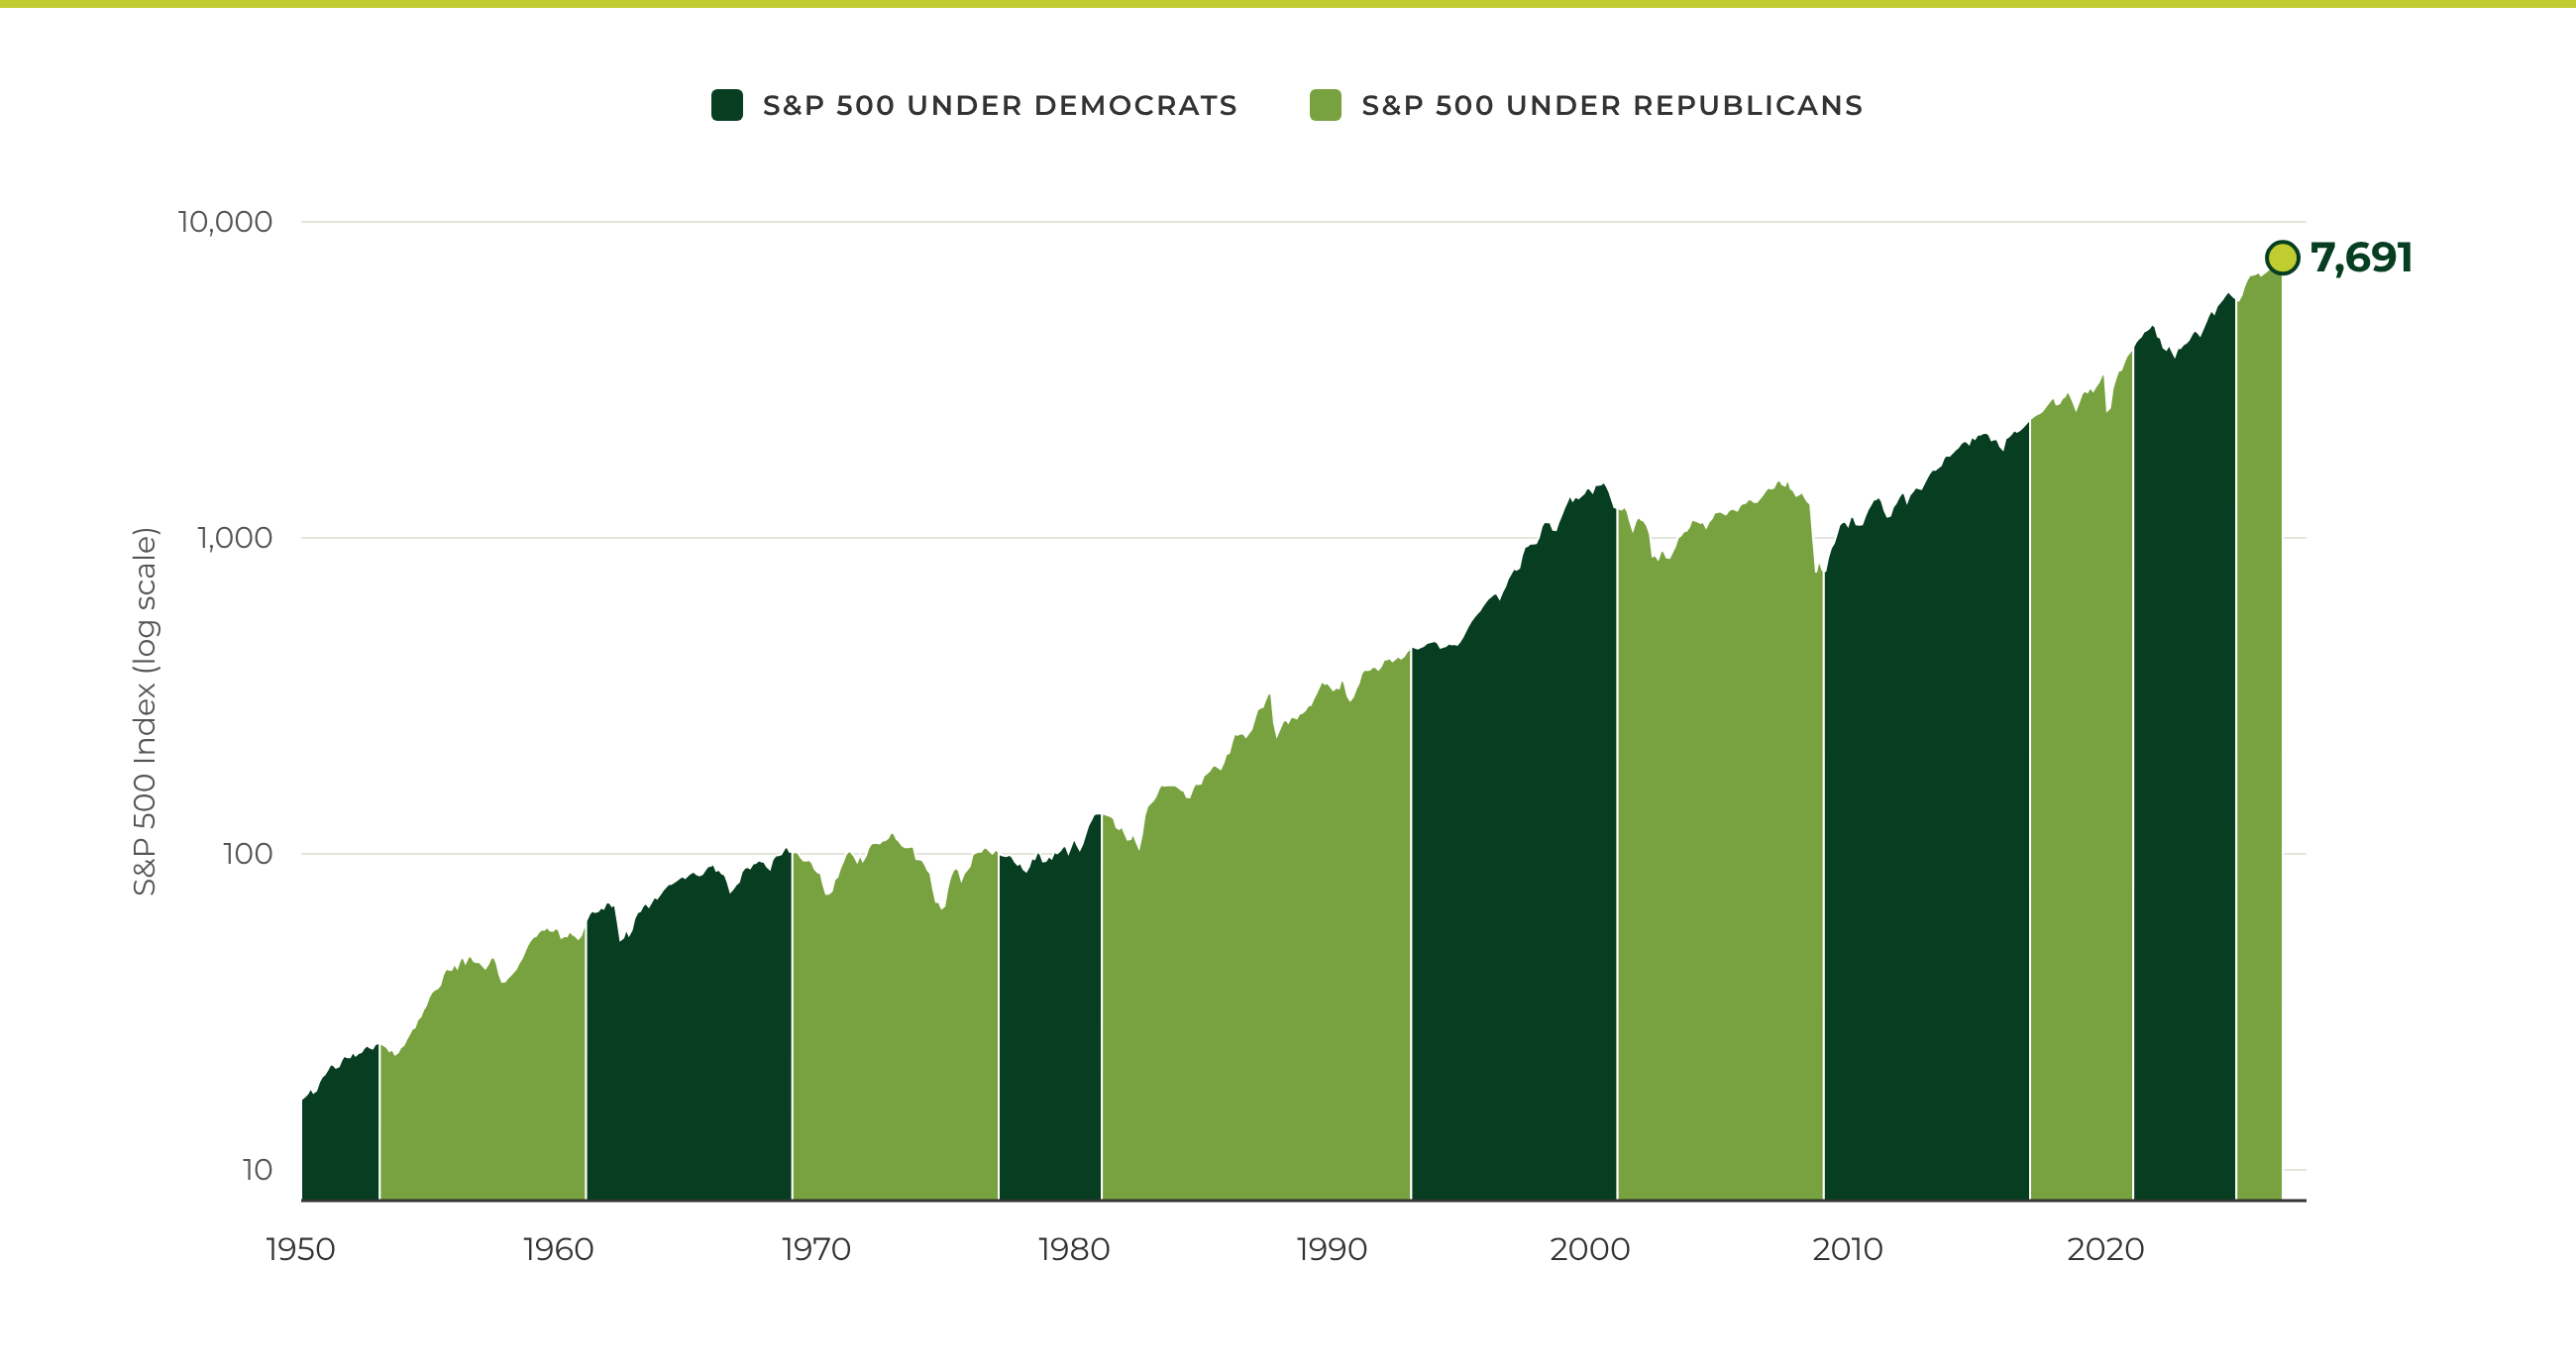
Source: © Exhibit A, FactSet Research Systems Inc., Standard & Poor’s. Latest: 2026-10-19. This chart is for informational and illustrative purposes only. The data provided is believed to be accurate, but there is no guarantee of its accuracy, completeness, or timeliness. This is not a recommendation or offer of any financial product. Past performance is not indicative of future results, and investors should consider their own objectives and risk tolerance. Indices, if presented, do not include fees, are unmanaged, and are not available for direct investment. The S&P 500 tracks the performance of 500 large-cap U.S. companies, serving as a benchmark for the U.S. stock market, and is weighted by market capitalization. The chart shows the S&P 500 index price since 1950, shaded by whether a Democrat or Republican was in the White House. It illustrates that over the long term, regardless of who is in political office, the S&P 500 has exhibited a long-term uptrend.
Now, to be clear, this is not to say everything is “noise” or should be treated as such. If you own a business that sells into the U.S., tariffs are a real planning conversation. But markets haven’t frozen up either. Year to date, many indices are positive (through October 19, the S&P/TSX Composite was up about 13% and the S&P 500 about 12%). For everything else, the Wharton article has a simple four-part filter (and it works for a lot more than investing decisions). If information fits even one of these, it’s most likely noise.
Signal or Noise? A Simple Four-Part Filter
Your brain can’t take it all in, so something has to decide what gets through.
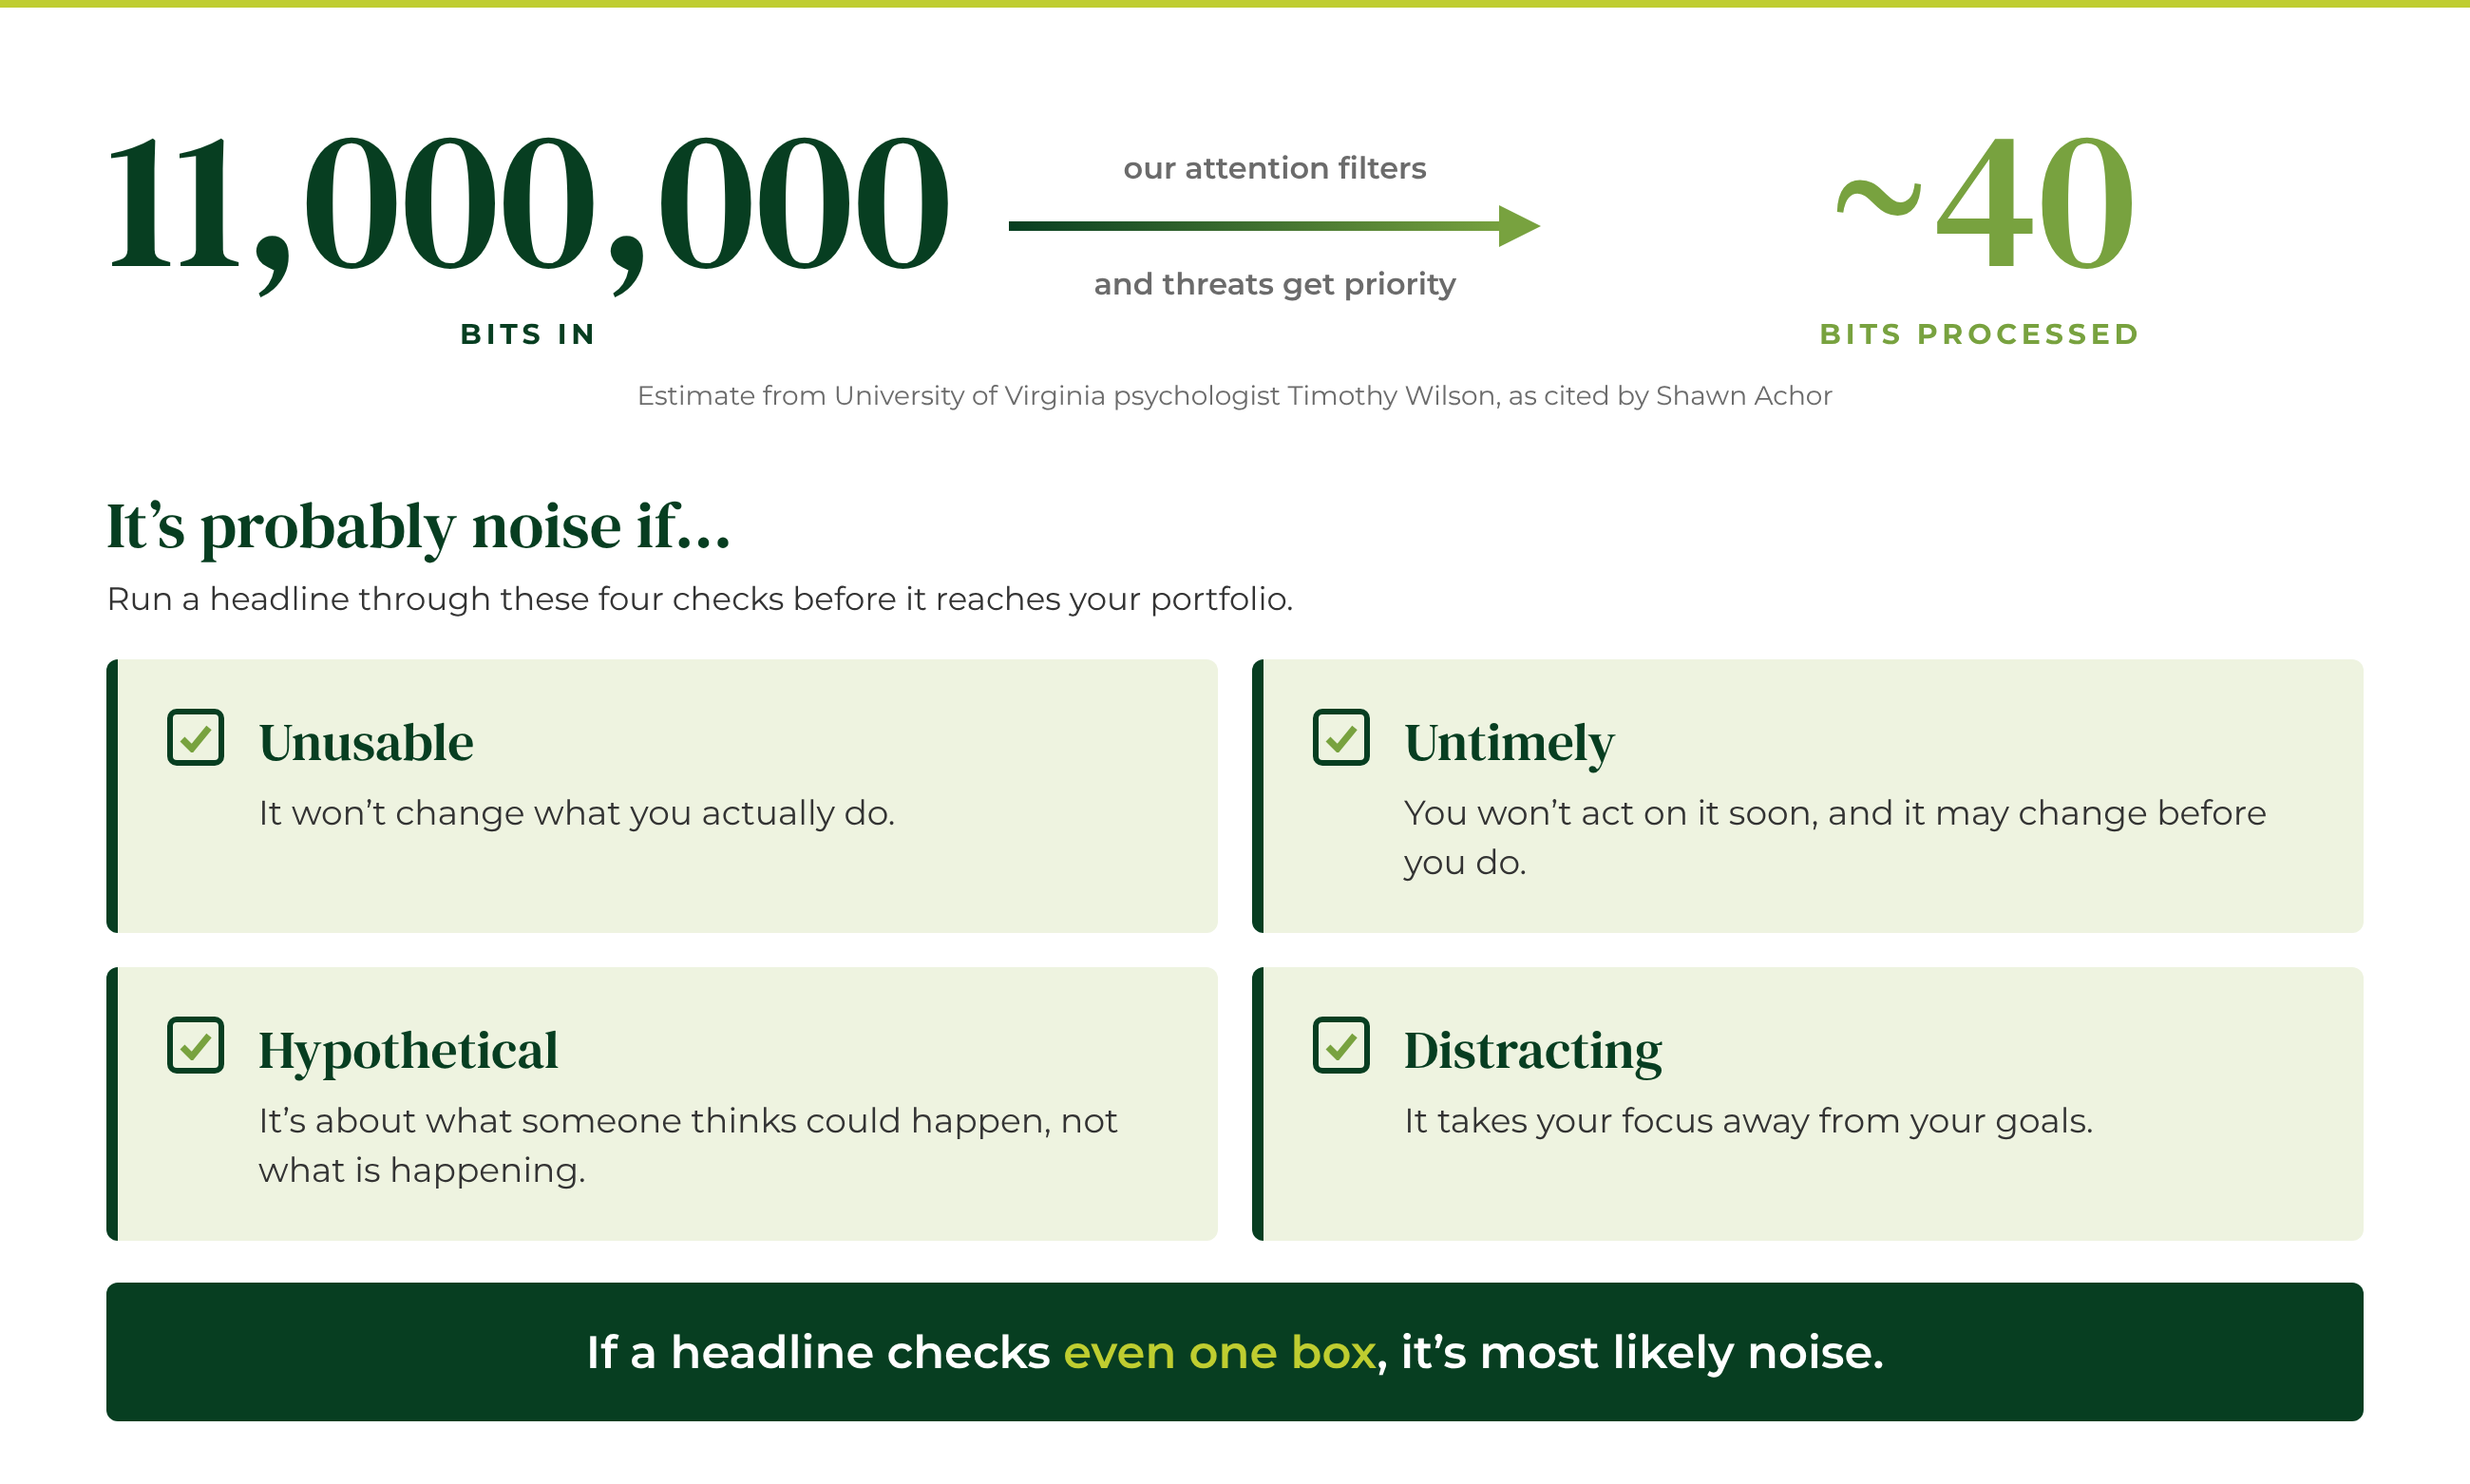
Source: Shawn Achor, “Increase Your Focus by Reducing Negative Noise,” Nano Tools for Leaders, Wharton Executive Education (June 2014). This graphic is for informational and illustrative purposes only and is not a recommendation or offer of any financial product. News that changes your circumstances (your income, your business, your cash needs, your timeline) may warrant a review of your financial plan. Please speak with your advisor before making changes to your portfolio.
So, what are you supposed to do about all of this? (We don’t want this article to feel like “noise” itself!) Kahneman called it “decision hygiene,” which is setting the rules before you need them. For investors, that’s the job of your financial and investment plan (and in many cases, the value of working with a financial advisor). You decide your asset allocation (we discussed this in depth in a previous PWM Perspectives), rebalancing ranges and cash reserves when things are quiet, so the plan does the thinking when the headlines are loudest. Achor also points to research showing that cutting your noise intake by just 5% helps. And like we said in April, you don’t have to completely ignore the headlines. Just keep them from driving the car.
Jiddu Krishnamurti may have put it best. Partway through one of his talks, on what you could call inner peace (or even peace of mind), he paused and asked the audience if they wanted to know his secret, meaning how he stayed so calm in such a challenging world. Then he said, “You see, I don’t mind what happens.” He didn’t demand any particular outcome from life, and that’s a good way to look at a portfolio, too. A portfolio that works only with a specific election result is really a bet, while one that covers your near-term needs first (especially if you have withdrawal needs, for example) and matches your risk profile can afford not to mind how any one election turns out.
And one last data point of interest in all of this, especially around headlines and politics and the like: the chart below shows the S&P 500’s return in the year after major geopolitical events since the Korean War. Not every year was positive, but the average was 14.2%, and as of October 20, the S&P 500 was up 11.8% since the Iran war began on February 28. While past performance is not indicative of future results, markets have tended to absorb these shocks faster than the headlines suggest (going back to the point earlier, your brain registers these events as a threat, but it can’t actually assess their outcome or impact).
S&P 500 After Major Geopolitical Events
S&P 500 1-year forward returns (%) after major geopolitical events since the Korean War.
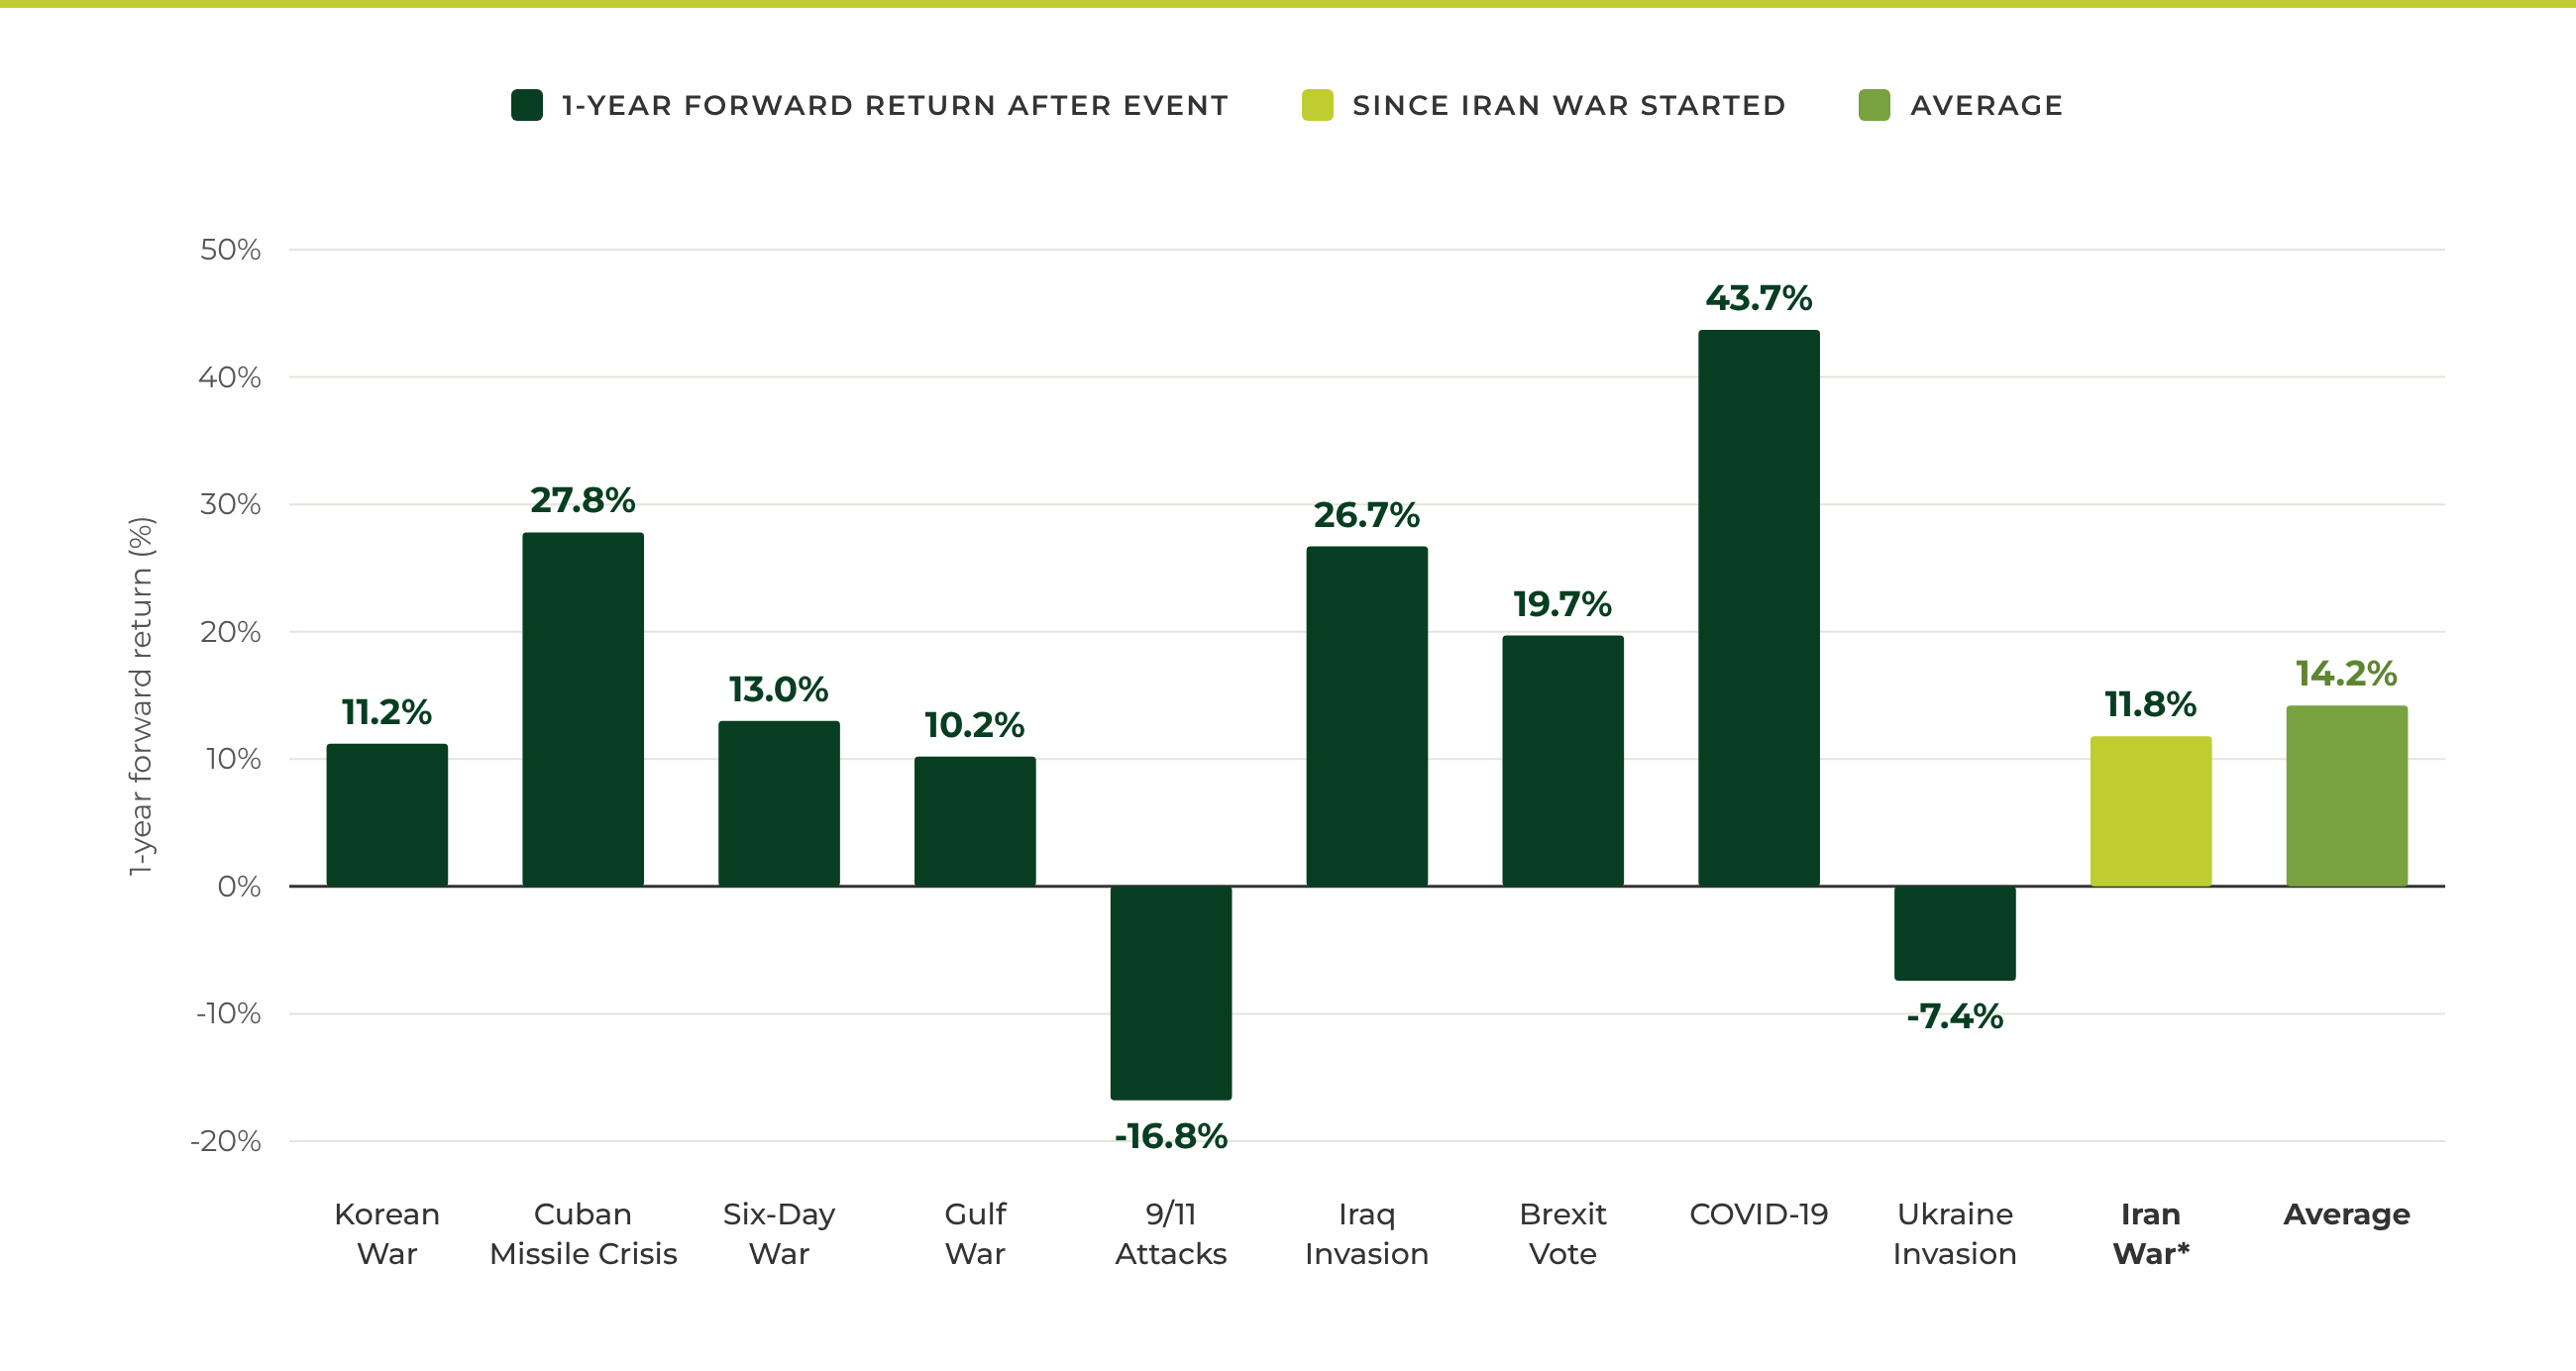
Source: © Exhibit A, FactSet Research Systems Inc., Standard & Poor’s. Latest: 2026-10-20. *Iran War return is since February 28, 2026, through October 20, 2026. This chart is for informational and illustrative purposes only. The data provided is believed to be accurate, but there is no guarantee of its accuracy, completeness, or timeliness. This is not a recommendation or offer of any financial product. Past performance is not indicative of future results, and investors should consider their own objectives and risk tolerance. Indices, if presented, do not include fees, are unmanaged, and are not available for direct investment. Returns are price returns. The chart illustrates that geopolitical conflicts, historically, have not deterred the S&P 500 on average. Dates are: Korean War: 06/25/1950, Cuban Missile Crisis: 10/16/1962, Six-Day War: 6/5/1967, Gulf War: 8/2/1990, 9/11 Attacks: 9/11/2001, Iraq Invasion: 3/20/2003, Brexit Vote: 6/24/2016, COVID-19: 3/11/2020, Ukraine Invasion: 2/24/2022, Iran War: 2/28/2026.
So how does all of this show up in your portfolio? Portfolio Managers Kevin Hegedus and Andrew Rodych don’t react to the noise, whether that’s a poll, a forecast or an election result. Portfolios are built and allocated relative to the factors that actually drive long-term returns, and to each client’s risk mandate, time horizon and cash needs. They continue to monitor markets and economic conditions and adjust allocations as needed, but those changes come from shifts in the underlying factors, not the headlines. Essentially, it’s decision hygiene built right into the portfolio. And if something has changed in your own life (your income, your business, your timeline), let’s talk.